Widgets are what you see on your Command Center — the visual representation of the reports you’ve built inside the settings.
Widgets → display the report on your KPI Dashboard
Reports → power the widget
FreedomOS → powers the report
Step 1: Open the Command Center:
Go to your Home Screen and click Edit Dashboard. You’ll now be in drag-and-drop edit mode
Step 2: Scroll to the bottom of the dashboard and click “Add Widget” 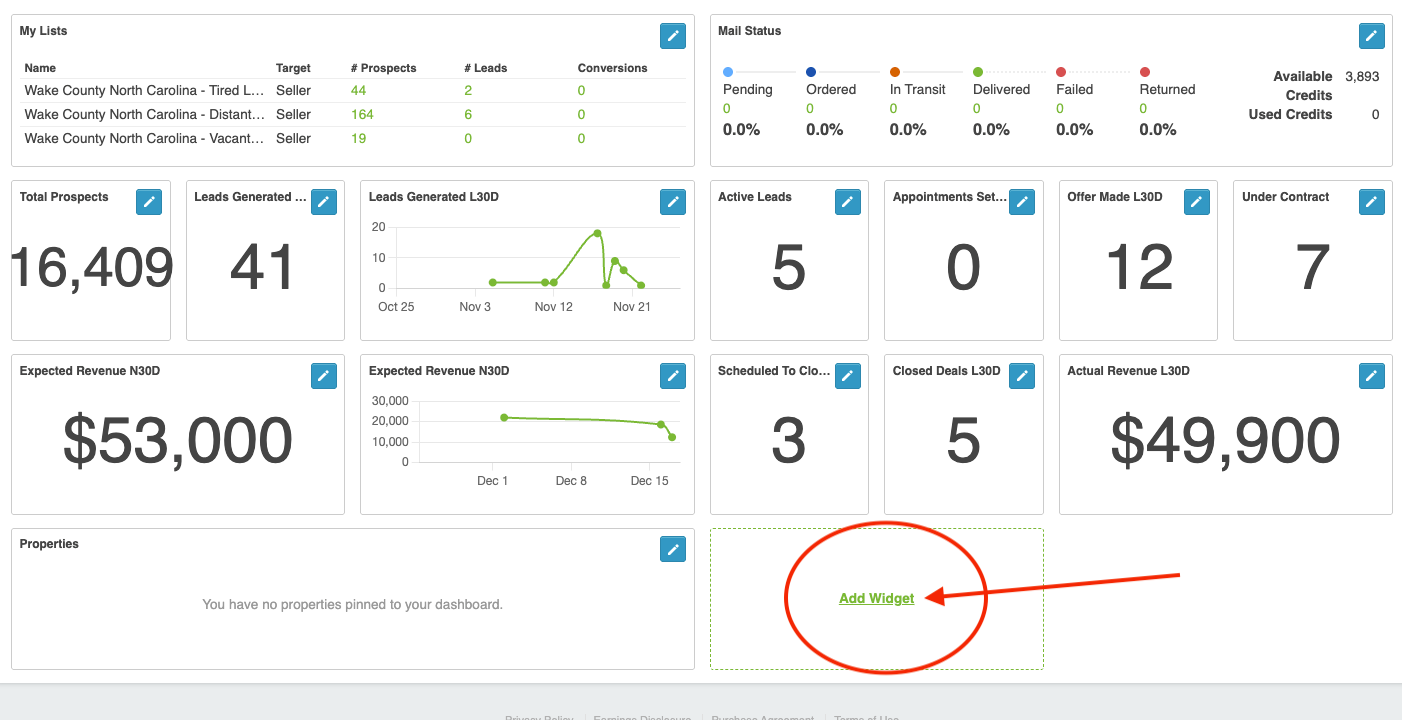
You can add:
- KPI report tiles
- Numeric summaries
- Bar charts
- Line graphs
- Pie charts
- Pipeline visualizations
- Trend graphs
Step 3: Choose the Report Source
Every widget must be tied to a report that exists in Settings → KPI Dashboard. If you don’t see the metric you need, create a new report first.
Step 4: Choose a Visualization
You can display your report as:
- A number
- A chart
- A graph
- A comparison
- A trend line
- A percentage
Step 5: Position the Widget
Drag it anywhere on the dashboard grid for the layout you want.
Step 6: Save Layout
Click Save to publish your Command Center updates.